Inset Plot in GRACE (Xmgrace)
Grace is an opensource data-analysis/plotting software. Grace runs on practically any version of Unix-like OS. As well, it has been successfully ported to Win9*/NT/2000/XP (some minor functionality may be missing, though).
The inset plot can be generated by following way:
- Give command in terminal: xmgrace dataset1.dat, (or import data by Data -> Import -> ASCII in other platforms) will create the plot of dataset1.dat in the main window (call it Graph1). Now for creating inset of another dataset let say dataset2.dat in the same graph please follow the following steps.
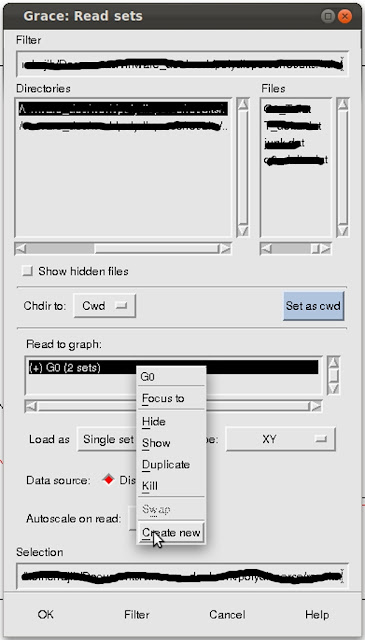
- Data -> Import -> ASCII to open the "Grace:Read Sets" dialogue box. Graph 1 created in step 1, is labelled G0.
- In the "Read to Graph" section the "(+) G0" graph is selected by default.
- Right-click on the "(+) G0" to open the pop-up menu (see the image).
- Now import the dataset2.dat by selecting '(+) G1'. It will generate Graph 2.
- At this point, Graph 2 will be only visible since both the graphs are superimposed. One can use the mouse to select the appropriate graph and resize it, however, since the Graphs are almost on top of each other, so one needs to use a different strategy.
- Go to "Plot -> Graph Appearence -> Viewport".

Select "Create new". It will create '(+) G1' empty graph.
Adjust the min and max values until it gives the best look.
Now change the Graph properties accordingly and save in the desired format.
You will end up with your desired plot with inset.


thanks
ReplyDeleteThank you Sir.
ReplyDelete